

What is happening to London house prices?
With all the conflicting news and HPI indices it’s hard to know what is actually happening to house prices in the capital. For a more detailed analysis of the central London property market, Lonres, whose data is provided by working professionals in the area, released its first quarter report on sales which demonstrates what is happening to London house prices in Q1 2023.
Unsurprisingly, journey times for selling your home in London have experienced delays in Q1. The knock-on effect to interest rates following the now infamous mini budget along with the cost-of-living crisis caused many buyers and even more first-time buyers to retreat. Affordability and uncertainty have caused the once “hot” UK property market to thaw.
In central London the percentage of properties still on the market after three months was on average 69.3%. The area with the largest proportion of properties languishing on the market, according to Lonres data, could be found in the City and the City fringes, with 76.7% closely followed by Knightsbridge and Belgravia at 75.5%.
Why is this? The latter is a highly affluent area, with equity-rich sellers who are prepared to wait for the right buyer who’ll pay closer to the asking price, which on average was only -5% down on last year. In the City fringes it was a similar story with only 36.2% of properties reducing their price, but even with a -3.9% discount, this was the area with the largest increase on last year’s achieved price at 5.5%.
Battersea, Wandsworth and Clapham, however, were the only other areas to achieve an increase in annual house prices and only by a small 0.1% margin. This was in stark contrast to their neighbours; Vauxhall, Nine Elms, Borough & Kennington who saw prices decrease by -9.6%.

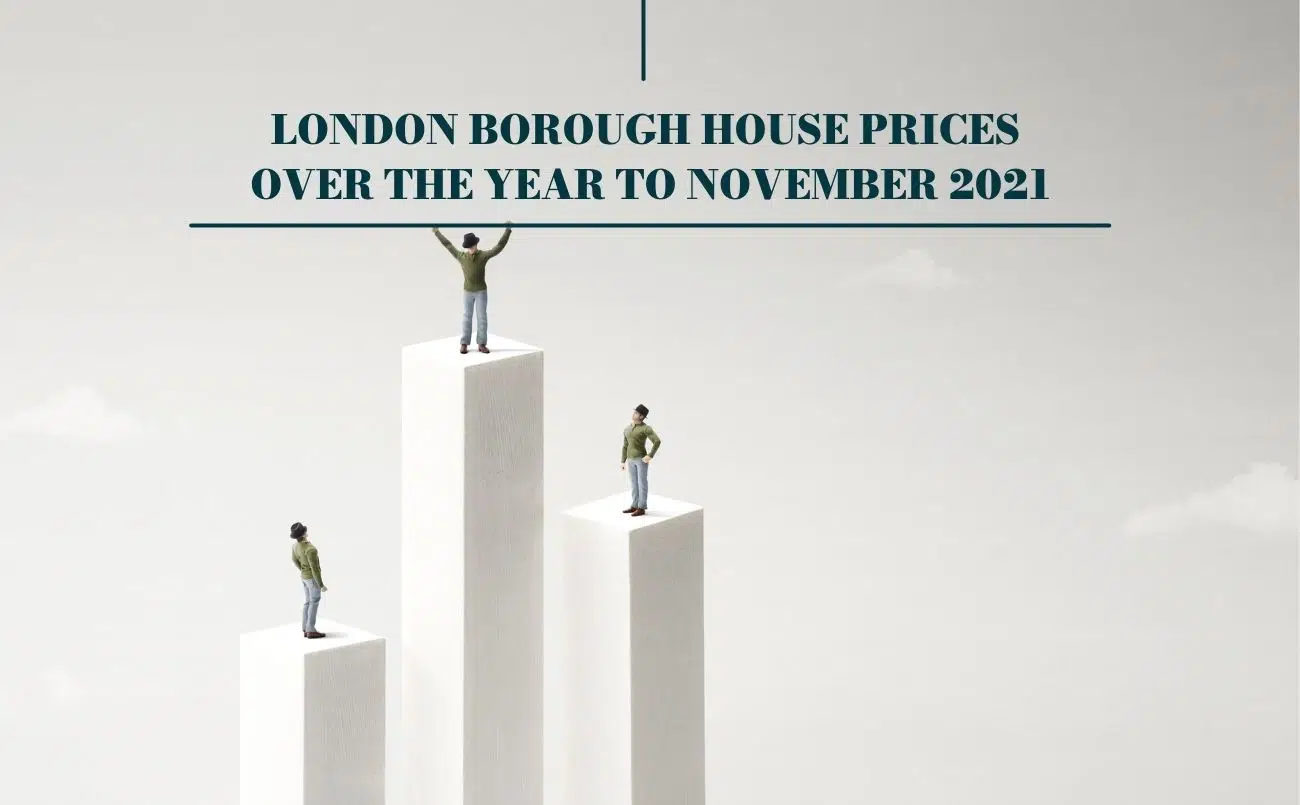
London house price status update for Q1 2023
London house price discounts
For those whose properties didn’t have the X factor, a price adjustment was needed to get them agreed. Across 20 of Central London boroughs an average of 45% of properties were discounted. Fulham and Earls Court came out as the areas with the biggest adjustment with just over half of all properties recalculating. The result? Average flat prices are now 1.1% lower than they were five years ago, with buyers paying £11 less per square foot than they did before.
However, the areas that experienced severe setbacks with the biggest annual change in achieved price were Mayfair and St James with -16.6%, closely followed by Fitzrovia, Bloomsbury and Soho at -10.6%. They also topped the leader board for the largest average discount on the initial asking price with drops of -13.9% and -12.8% respectively.
For those who like to haggle, the area with the most resistance was in Islington and Kings Cross with a modest average discount of -3.8% and annual prices down only -1.8%.
What the next quarter holds for central London, no one really knows but I’d expect further delays in the short term with an improved service come the end of the year. Till then, you are up to date on what is happening to London house prices in Q1.